Figure
1.1.2
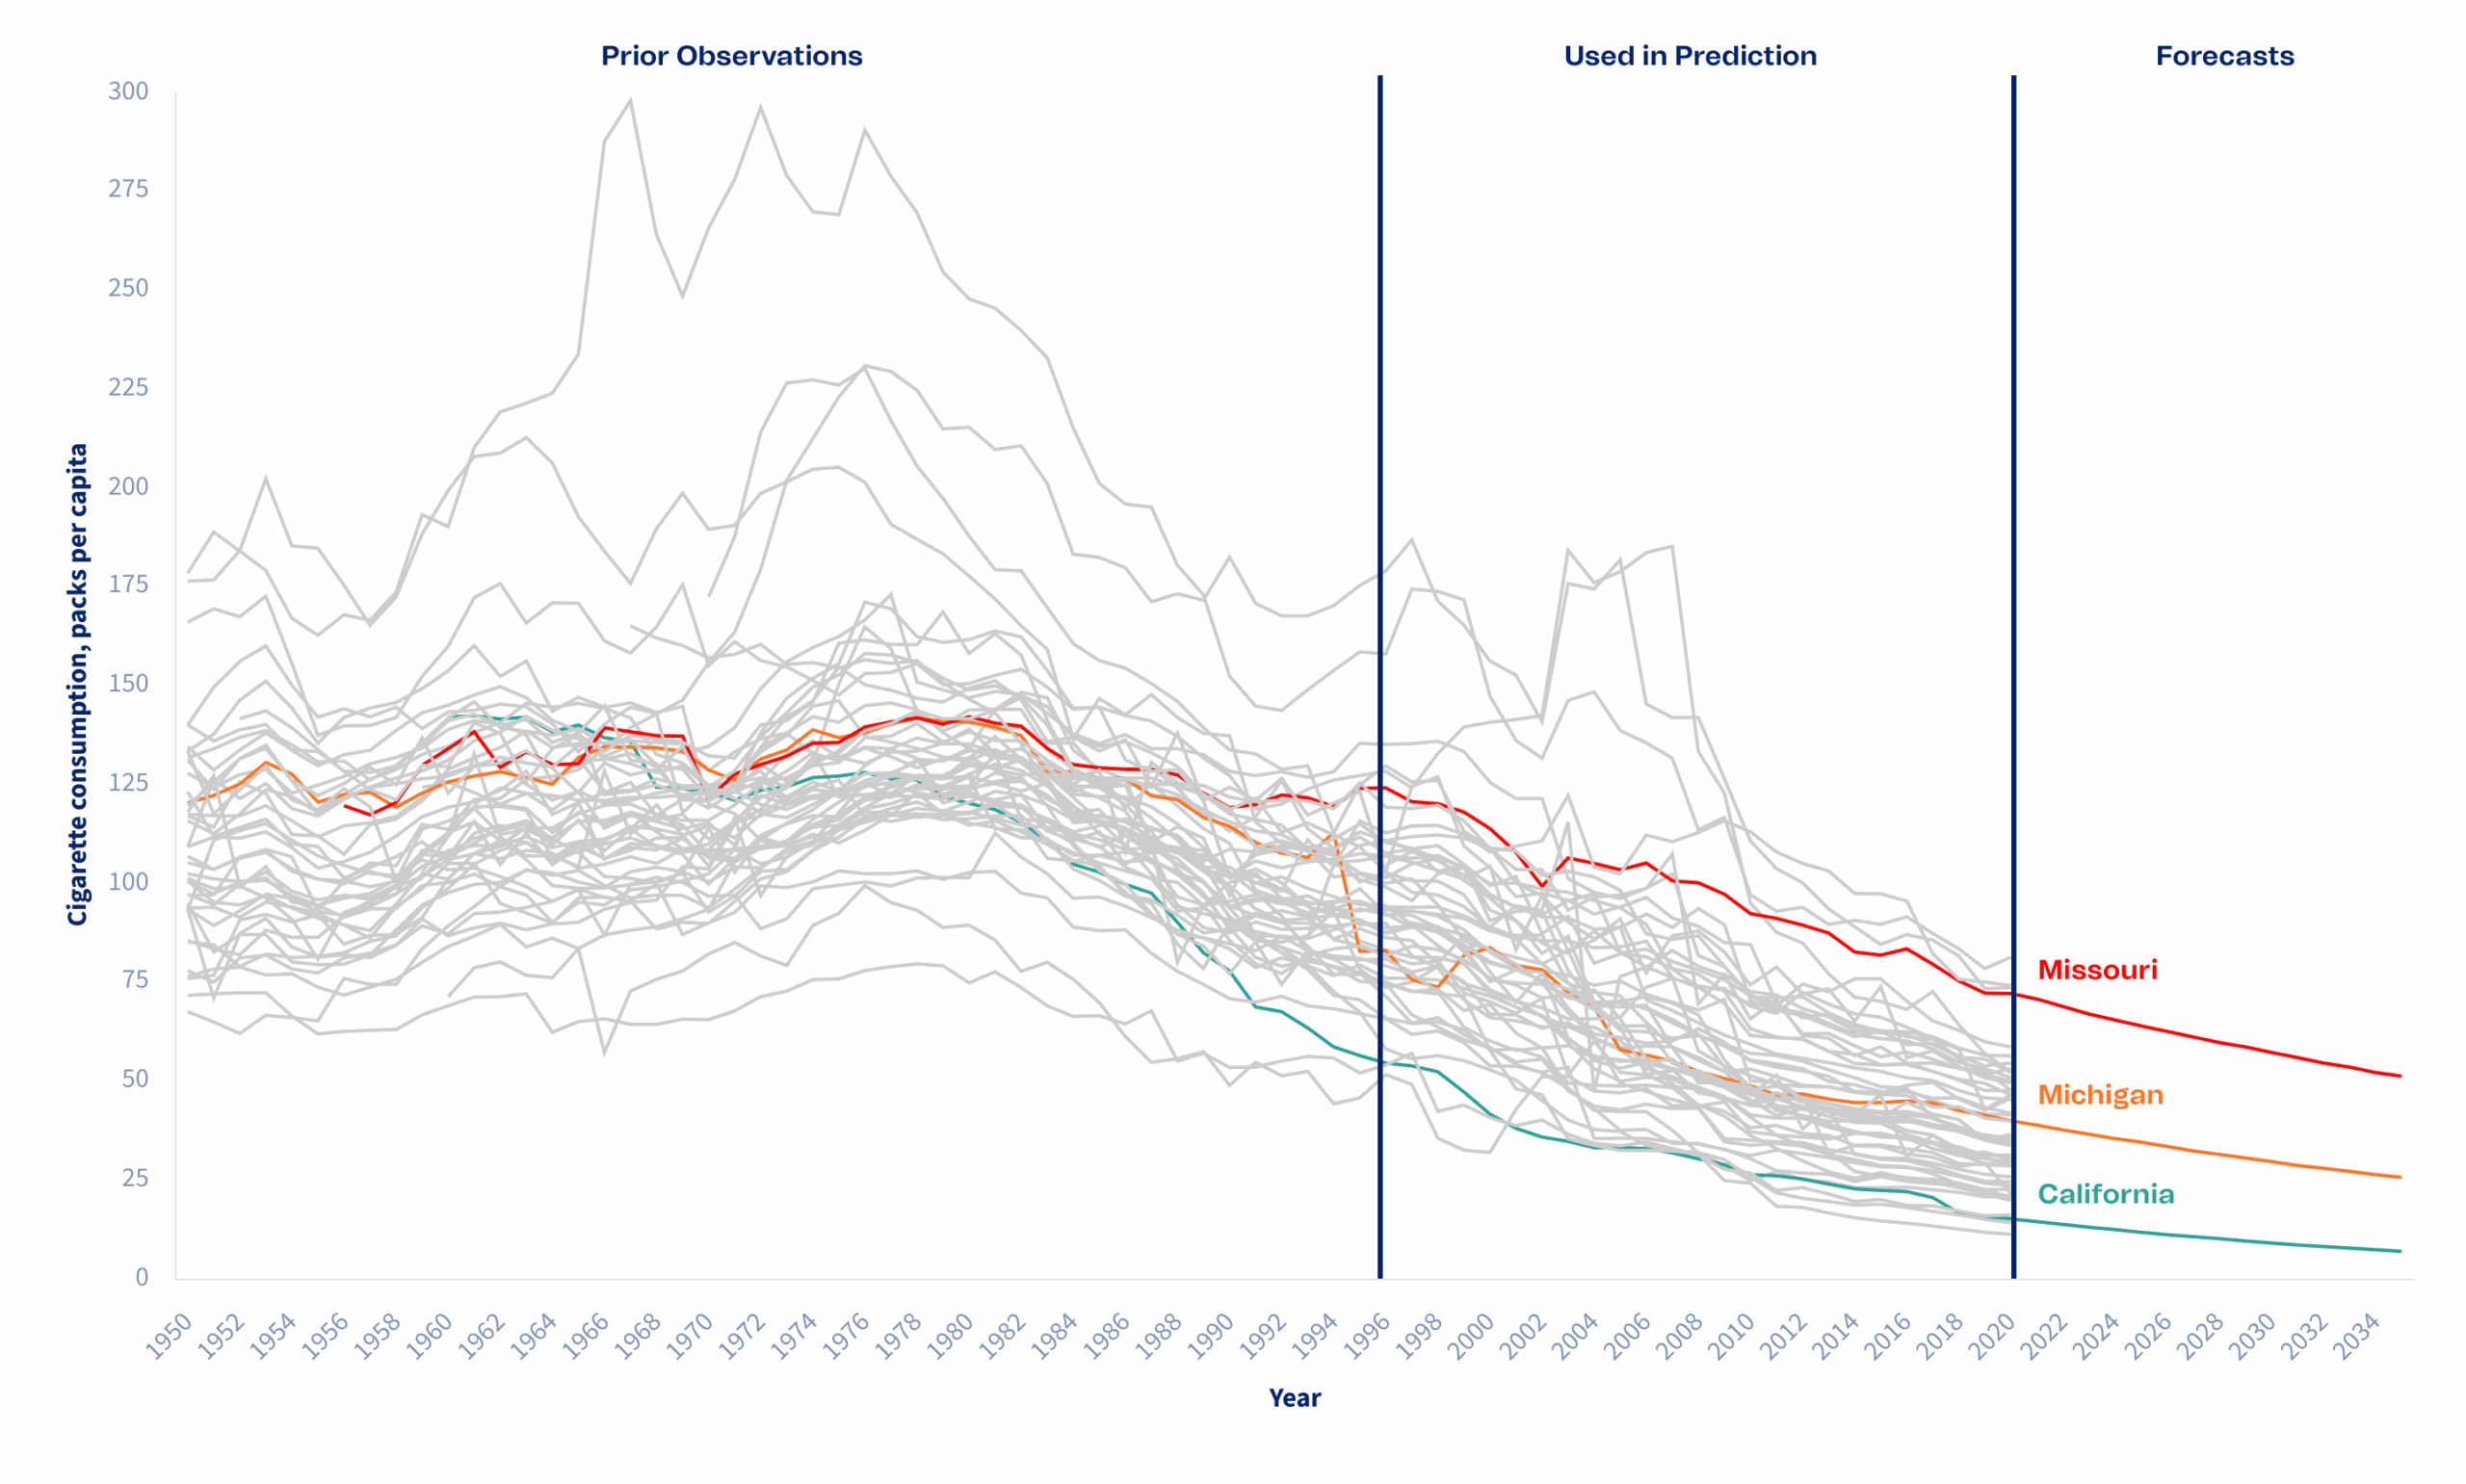
Cigarette consumption (packs per capita) forecasted to 2035
Though decreasing overall, forecasts of cigarette consumption show Missouri and Michigan (among other states) may not meet public health targets by 2035.
Footnote
Annual estimates of per capita cigarette consumption are expressed as the number of tax-paid cigarette packs per capita for each of the 50 US states (N = 3,550 total estimates of cigarette consumption). Forecasts for the expected per-capita cigarette consumption from 2021 through 2035 were constructed using a state-specific autoregressive integrated moving average (ARIMA) model.
Sources
- 1950–2020 Tax Burden on Tobacco Reports; Leas EC, Trinidad DR, Pierce JP, McMenamin SB, Messer K (2023) Trends in cigarette consumption across the United States, with projections to 2035. PLoS ONE 18(3): e0282893. https://doi.org/10.1371/journal.pone.0282893